By now we’re all painfully aware of COVID-19 and the associated virus. Economies worldwide are going into lockdown. In the US, conscientious citizens are voluntarily isolating themselves and practicing social distancing. Europe is the current epicenter of the crisis with thousands of new cases daily and hundreds of new deaths.
The amount panic and fear is palpable and, finally, probably commensurate with the threat this disease poses to us. The tactics we are employing are likely to work – many epidemiological models highlight the efficacy of these things to stave off spread. I’m working on an agent based model of spread that shows exactly how important and efficacious these burdensome new social norms will be at saving the most at-risk among us – a preview of that work has been published here, with more to come. It’s important to keep clearly in mind that your actions matter. A small annoyance to you could mean saving the life of someone’s parents or grandparents.
We haven’t done ourselves any favors in the US with how we’ve handled this outbreak so far. Though experts clearly warned of the dangers here and instructed our government to prep testing kits immediately we were largely asleep at the wheel. Our President simply didn’t take the threat seriously until the past week, which is a shame. I applaud his bold action now and hope we can all support him in dealing with this crisis. There will be plenty of time to lay blame after COVID-19 has come and gone.
One of the things I heard from those attempting to downplay this crisis was that many viruses including many coronaviruses don’t thrive in warmer weather. The idea here was that if we can just make it to Summer things will improve. I was originally quite skeptical of this view – mostly because when I first encountered it, statements about the weather saving us were being uttered alongside all kinds of other misinformation (“it’s just the flu”, “it’s generally mild”, “we don’t have that many cases in the US”, etc.).
Time and additional data has put to bed many of these misconceptions. We are now taking this virus much more seriously. COVID-19 is not the flue. It isn’t mild. I should know, I’m 37 years old and healthy and I am fairly certain I had it, though at the time there weren’t enough tests to verify my case. At least in my case, the illness was fairly debilitating – more-so then the average seasonal flu or head cold.
But with so much despair going around – I wanted to use my data science background to try and settle the Summer question. We have had nothing but bad news and, frankly, bad luck so far on this outbreak. Could the universe could throw us a lifeline as things warm up in the northern hemisphere?
I want to preface this analysis with the fact that I’m not an epidemiologist or virologist. I am a data scientist. I have the unique ability to collate large quantities of disparate data to try to paint a picture of how this crisis is likely to play out with respect to the weather. Importantly there are currently two studies on this exact subject I’m aware of and their findings do not perfectly match my own (particularly in terms of the impact of humidity on viral spread).
One paper available here uses an ecological niche modeling (also known as species distribution modeling) combined with ensembles of 10 different machine learning techniques to predict monthly changes. The data inclusion criteria extends to regions with more than just 5 cases. My cutoff for community spread is much higher – at least 100 cases. I’m also looking for more straight-forward, high level patterns. Their model predicts increases in relative humidity and temperature will both restrain the virus as is seen with seasonal flu and the prior COV SARS virus.
The second paper out of Beijing focuses on data from the Asian-Pacific region collected between February 8th through 29th, for cities with at least 20 cases. Again, my cut off for community spread is much higher. This paper agrees roughly with the findings of the first – that this virus will have a more difficult time spreading in warmer, more humid weather.
The strengths of these papers are their attempt to find targeted samples of data that eliminate the noise, and the application of relatively complex modeling techniques to understand spread. The weakness, in my opinion and from a data science perspective, is the number of degrees of freedom available to them when making these decisions and trying to target what the “true” data actually is. By comparison, my analysis takes a far less complex approach and includes a broader swath of the available data.
One other key point of difference – I approach this as a prediction problem at the level of the case counts per day. By doing this I can look at lagging environmental conditions prior to those case counts. If the relationship between climate and spread is causal that causal relationship should make itself evident in the daily trends in single locations with local weather variation – a nice way to control for response variables that can be very different between locations. The conclusions from this analysis end up being less clear than I hoped, but the plots are presented here nonetheless.
The studies above treat the environment in each location as more of a static truth, comparing longer-term rates of spread between locations with different climate-characteristics. Variations in local weather can be dramatic and these swings should be expected to have a measurable and important impact on spread. In short – each approach has its own strengths and weaknesses and it’s important to consider all available data when trying to predict disease progression.
So here goes…
NOTE: I’m using data from the BNO News tracker for case and death counts. This requires text parsing which can sometimes result in clerical errors – the large findings should hold regardless. These counts are tied together with structured weather and economic data from the Wolfram Language. All the programming was done in Mathematica.
First I looked at daily percentage increases of case counts at the country level vs trailing average daily temperature and humidity. The data challenges here are real and mostly ignored – I’m just trying to get a high level… where does our enemy feel most comfortable?
The graph below shows the daily % case growth vs the 5-day trailing average temperature by country. To avoid small denominator issues and confusion arising from imported cases vs community spread I’ve restricted to country-dates where the total cases had reached at least 100. Also note – I check 1-day, 3-day, 5-day, 10-day and 14-day trailing averages. For both plots, all moving average windows showed the same effect directionally – I’m only showing the plots here for the moving average windows where the effect was strongest.
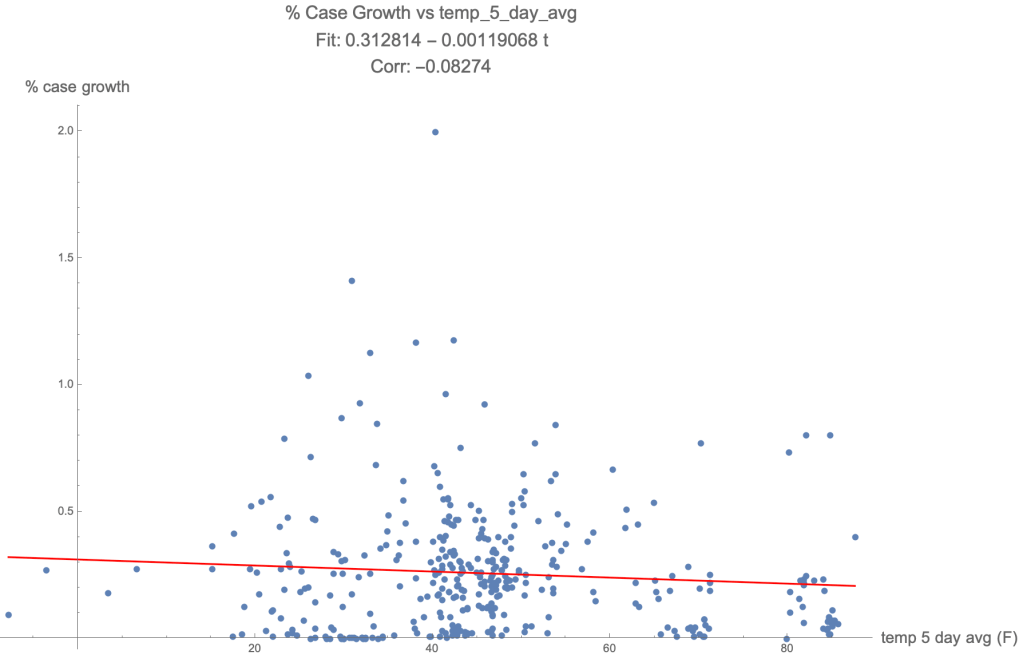
Though the direction of the effect is encouraging here – the relationship is quite noisy. It’s not compelling to me that there’s any relationship between temperature and spread from the above plot.
Encouragingly – humidity did have a much clearer relationship to spread:
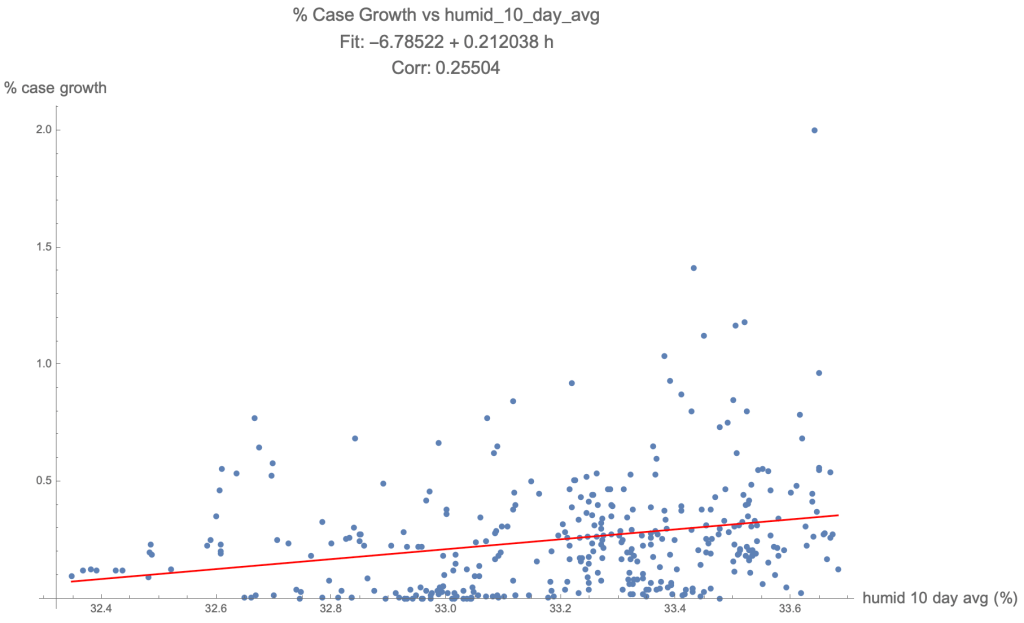
I didn’t imagine I’d find something so visibly obvious with humidity – so this is was to see. Given how messy the data is and the number of confounding variables we aren’t considering, more detailed analysis is required here. It also gives me pause that this relationship directly contradicts the published research – most likely I’m missing some key variable.
My personal expertise is in model building and prediction. I wanted to see if considering both temperature and relative humidity together would allow us to target COVID-19’s ideal environment even further. I trained a simple multivariate model on a random sample of half the available data points (n=183) and used that model to predict the other out-of-sample set. The results are below:
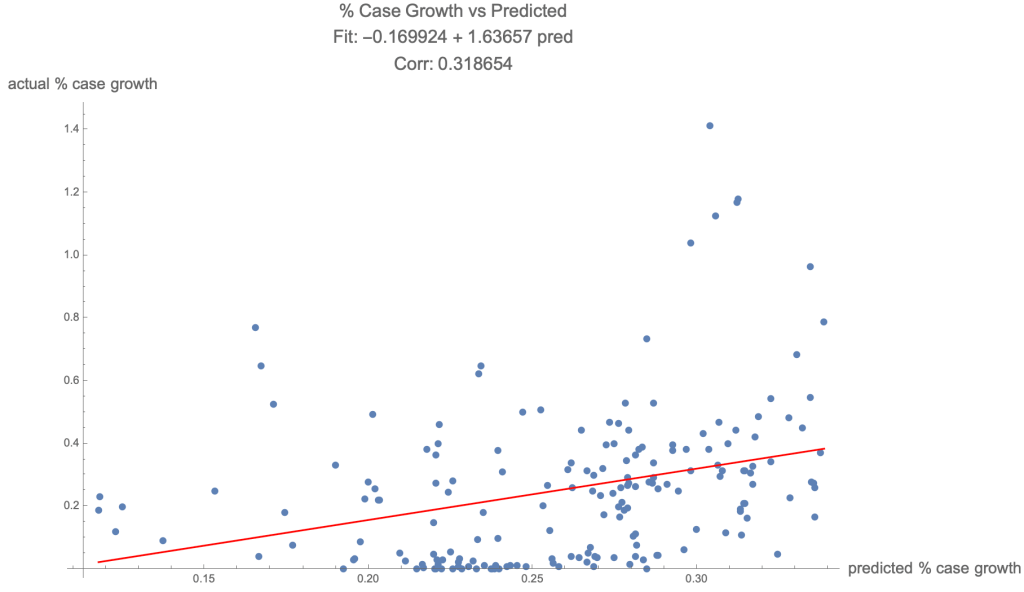
Again, these findings are extremely preliminary and the samples are small. But it does seem like a simple regression model considering temperature and humidity can meaningfully anticipate the rate of new case growth.
To further explore the relationships here we can go inside each country and look at how geographically diverse country outbreaks compare. This will better normalize for things like national response, with the goal of either refuting or reaffirming the findings above.
The sample size of countries with diverse climates and enough cases / time to meaningfully analyze is small, at least for now. China is actually the perfect candidate here as it’s geographically massive, has many diverse climates and an abundance of data. The only issue with the China data is trying to account for the impacts of their massive coordinated quarantines and other response measures.
To ensure consistency in the comparison I’m restricting to only province-dates where the accumulated cases are greater than 100 as before. I’m also restricting to those provinces that have had at least 20 total days of being over 100 accumulated cases. Those provinces who have only a few days of over 100 cases are much more likely to have imported those cases from other hot-spots, or be at the tail end of spread, then to be experiencing large-scale community spread of the sort I’m most interested in.
Restricting to these provinces / cities leaves us with 6 geographies: Hubei province, Guangdong province, Henan province, Shandong province and Beijing. The plots created show the entire timeline of the % case increase from total confirmed cases the day prior, and the lines are shaded to show climate: darker red implies higher average temperature during the timeframe:
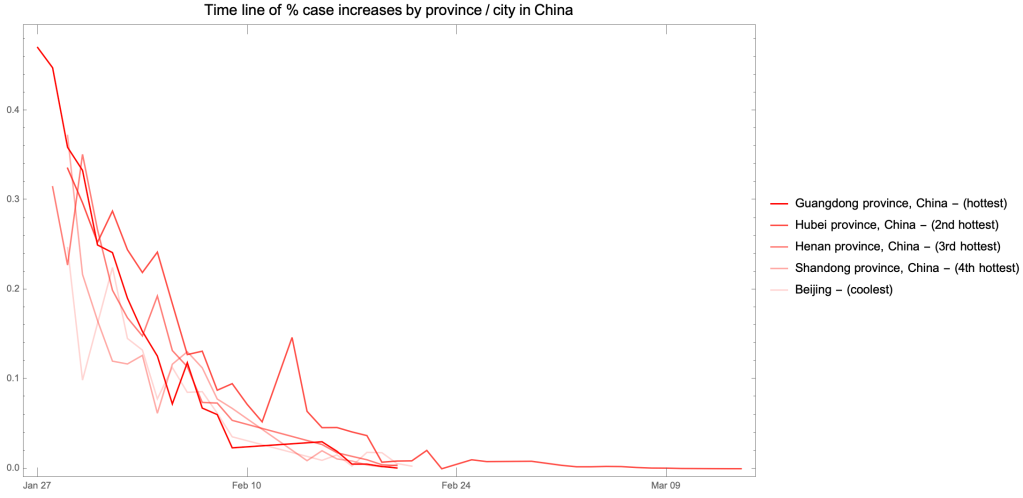
Below the darker blue implies higher relative humidity during the timeframe:
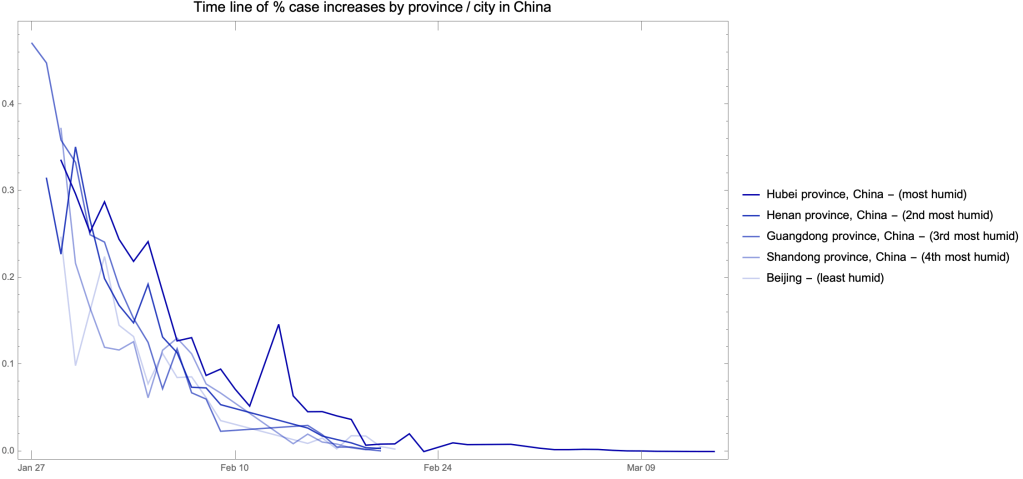
Again – this is far from a definitive proof that hotter, dryer climates are less hospitable for the virus, but it adds to the picture painted above at the country level.
To summarize what I see here – I think it seems plausible, contrary to the two research papers listed here, that the SARS-CoV-2 virus is more likely to spread faster in more humid climates. The case for temperature seems less strong, if more hopeful. Directionally the temperature relationship is what we’d hope to see going into summer.
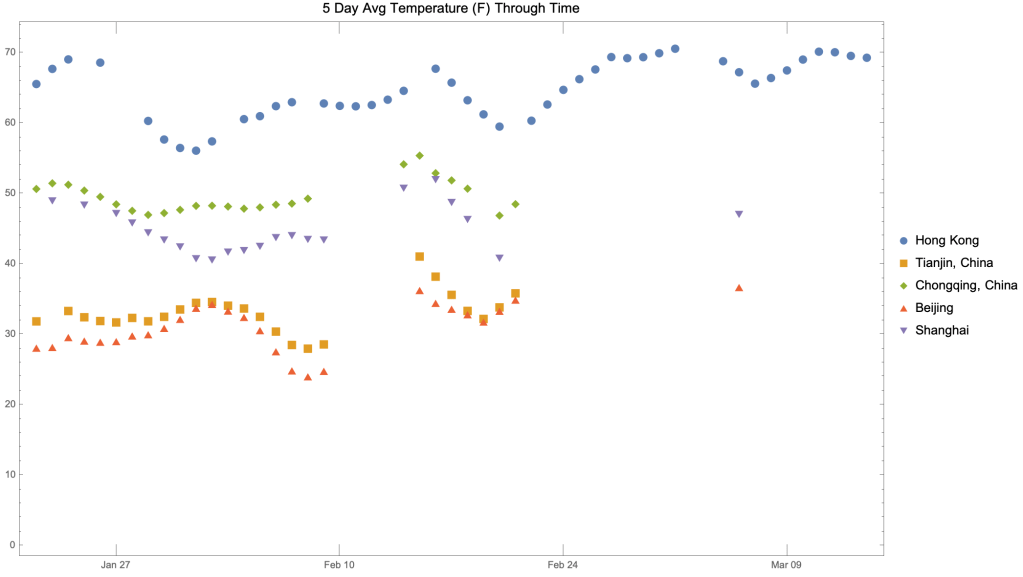
Finally – to get closer to determining causality I wanted to look at local climate variation to see if lagging weather conditions were indeed predictive of changes in local rates of spread. Focusing on a single city allows us to eliminate many confounders including policy response differences, testing differences, population density, and travel restrictions at the city level. I don’t have a lot of city-level data, but I do have enough data to do some analysis on some key cities in China including Tianjin, Chongqing, Beijing, Shanghai and also Hong Kong.
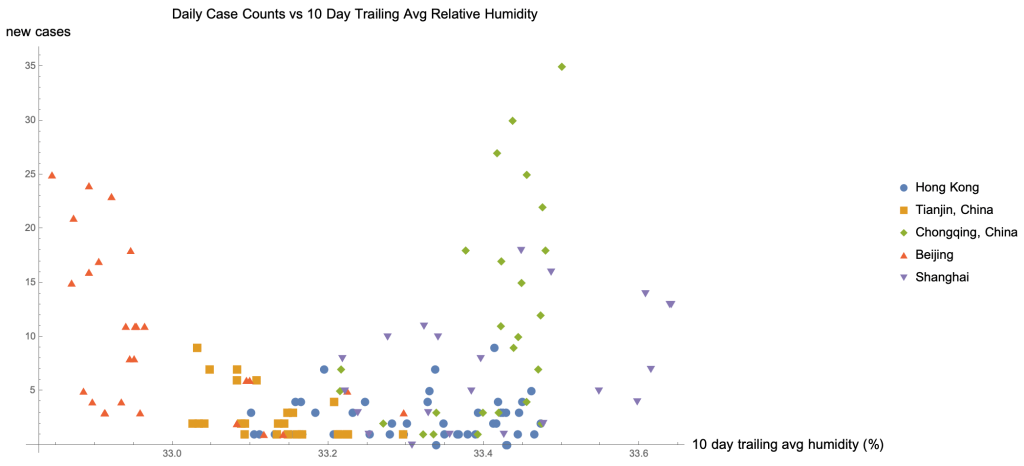
This view of humidity is interesting. In Tianjin and Beijing there is a clear negative correlation between trailing 10 day avg humidity and new cases. In Shanghai and Chongqing the relationship is exactly the opposite – a clear positive correlation exists. Between these camps is Hong Kong which shows a slight positive relationship.
The meaning of these relationships is confounded by a correlation between local response patterns to the emerging pandemic and trends in humidity change.
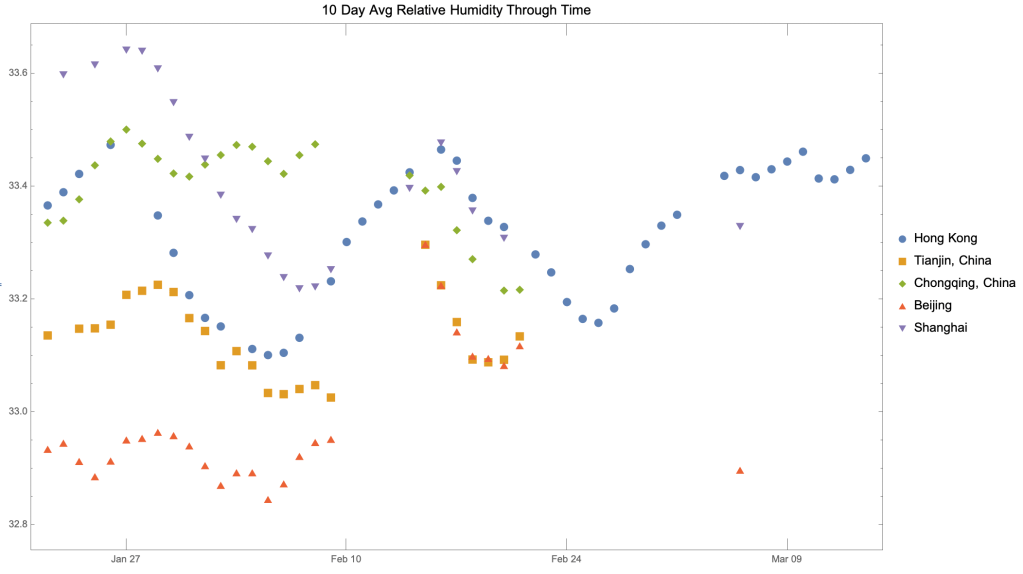
The two instances showing a strong negative correlation between trailing humidity and new case counts (Tianjin and Beijing) also show large increases in humidity well after the outbreak was understood and response was organized. The two instances confirming the relationship (Chongqing and Shanghai) show the exact opposite – a falling trend in relative humidity corresponding to an increase in social response. Hong kong, our middling case, shows middling trends in relative humidity. Unfortunately these plots to tells us more about local response than it they do about the impact of climate on COVID-19 spread.
The picture for temperature is similarly muddy.
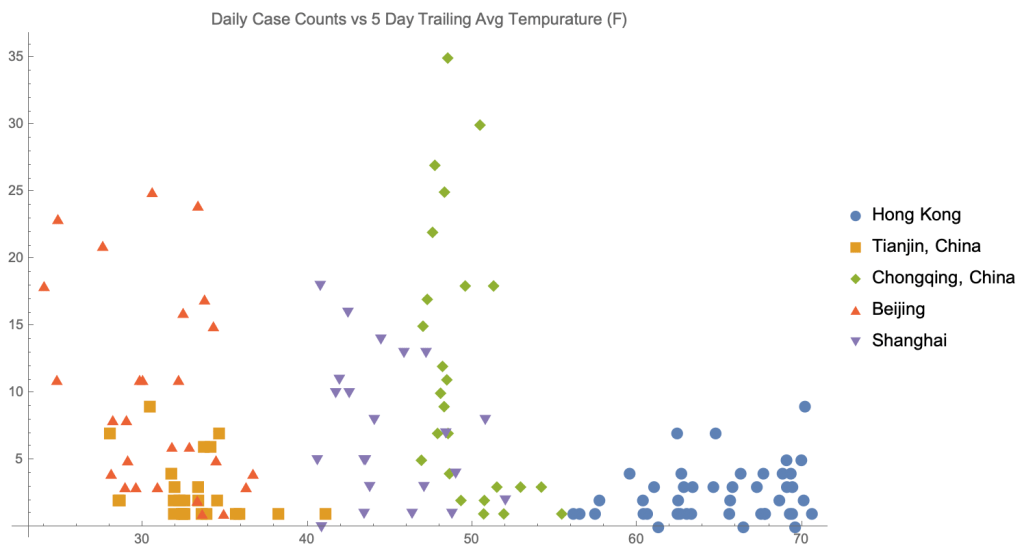
Similar trends can be seen between temperature and spread, but when contextualized against local response timelines the causality is not clear.
As more data is available it will be extremely interesting to see how COV SARS-2 behaves in different climates. I was hoping to find clearer evidence that Summer would stifle spread – but by digging through this data I was not necessarily encouraged. I would obviously put much more faith in the researchers looking into this as they are the true experts – I just wanted to share my own work on the subject to add to the conversation.
